Towards a genetic study of aphantasia
Apr 12, 2017
Exploring the prevalence of a mental phenotype through a citizen survey.
About a year ago, Laura Huckins and I got interested in a condition that made the headlines in the small world of psychiatry : aphantasia. According to a paper in Cortex published by Dr. Zeman, aphantasia is:
« a condition of reduced or absent voluntary imagery»
Interestingly, the article mentions congenital aphantasia, which immediately suggests that the disease is heritable, providing a starting point for a potential genetic study of the disorder.
We set out to create a web-based version of the VVIQ questionnaire used by the original authors of the paper to assess severity of aphantasia, along with a companion website to present the results and give some basic information to visitors about the disorder. We published the questionnaire on social networks and a few months into the study, collected about 600 answers, which we assembled into a report.
Briefly, we confirmed the rarity of the condition, despite our estimate of prevalence being about double that reported by Zeman et al, at 4.3% compared to their 2%. It is quite possible that our questionnaire was answered primarily by people who suspected they might have the condition, biasing our estimate upwards. We also confirmed a slightly higher male prevalence.
We performed an approximate power calculation and estimated that more than 1,400 answers would be needed to reliably estimate prevalence and the influence of sex. Back then, we had 600 responses.
Time has passed since then, and the number of respondents has doubled. We thought it would be interesting to re-evaluate the results.
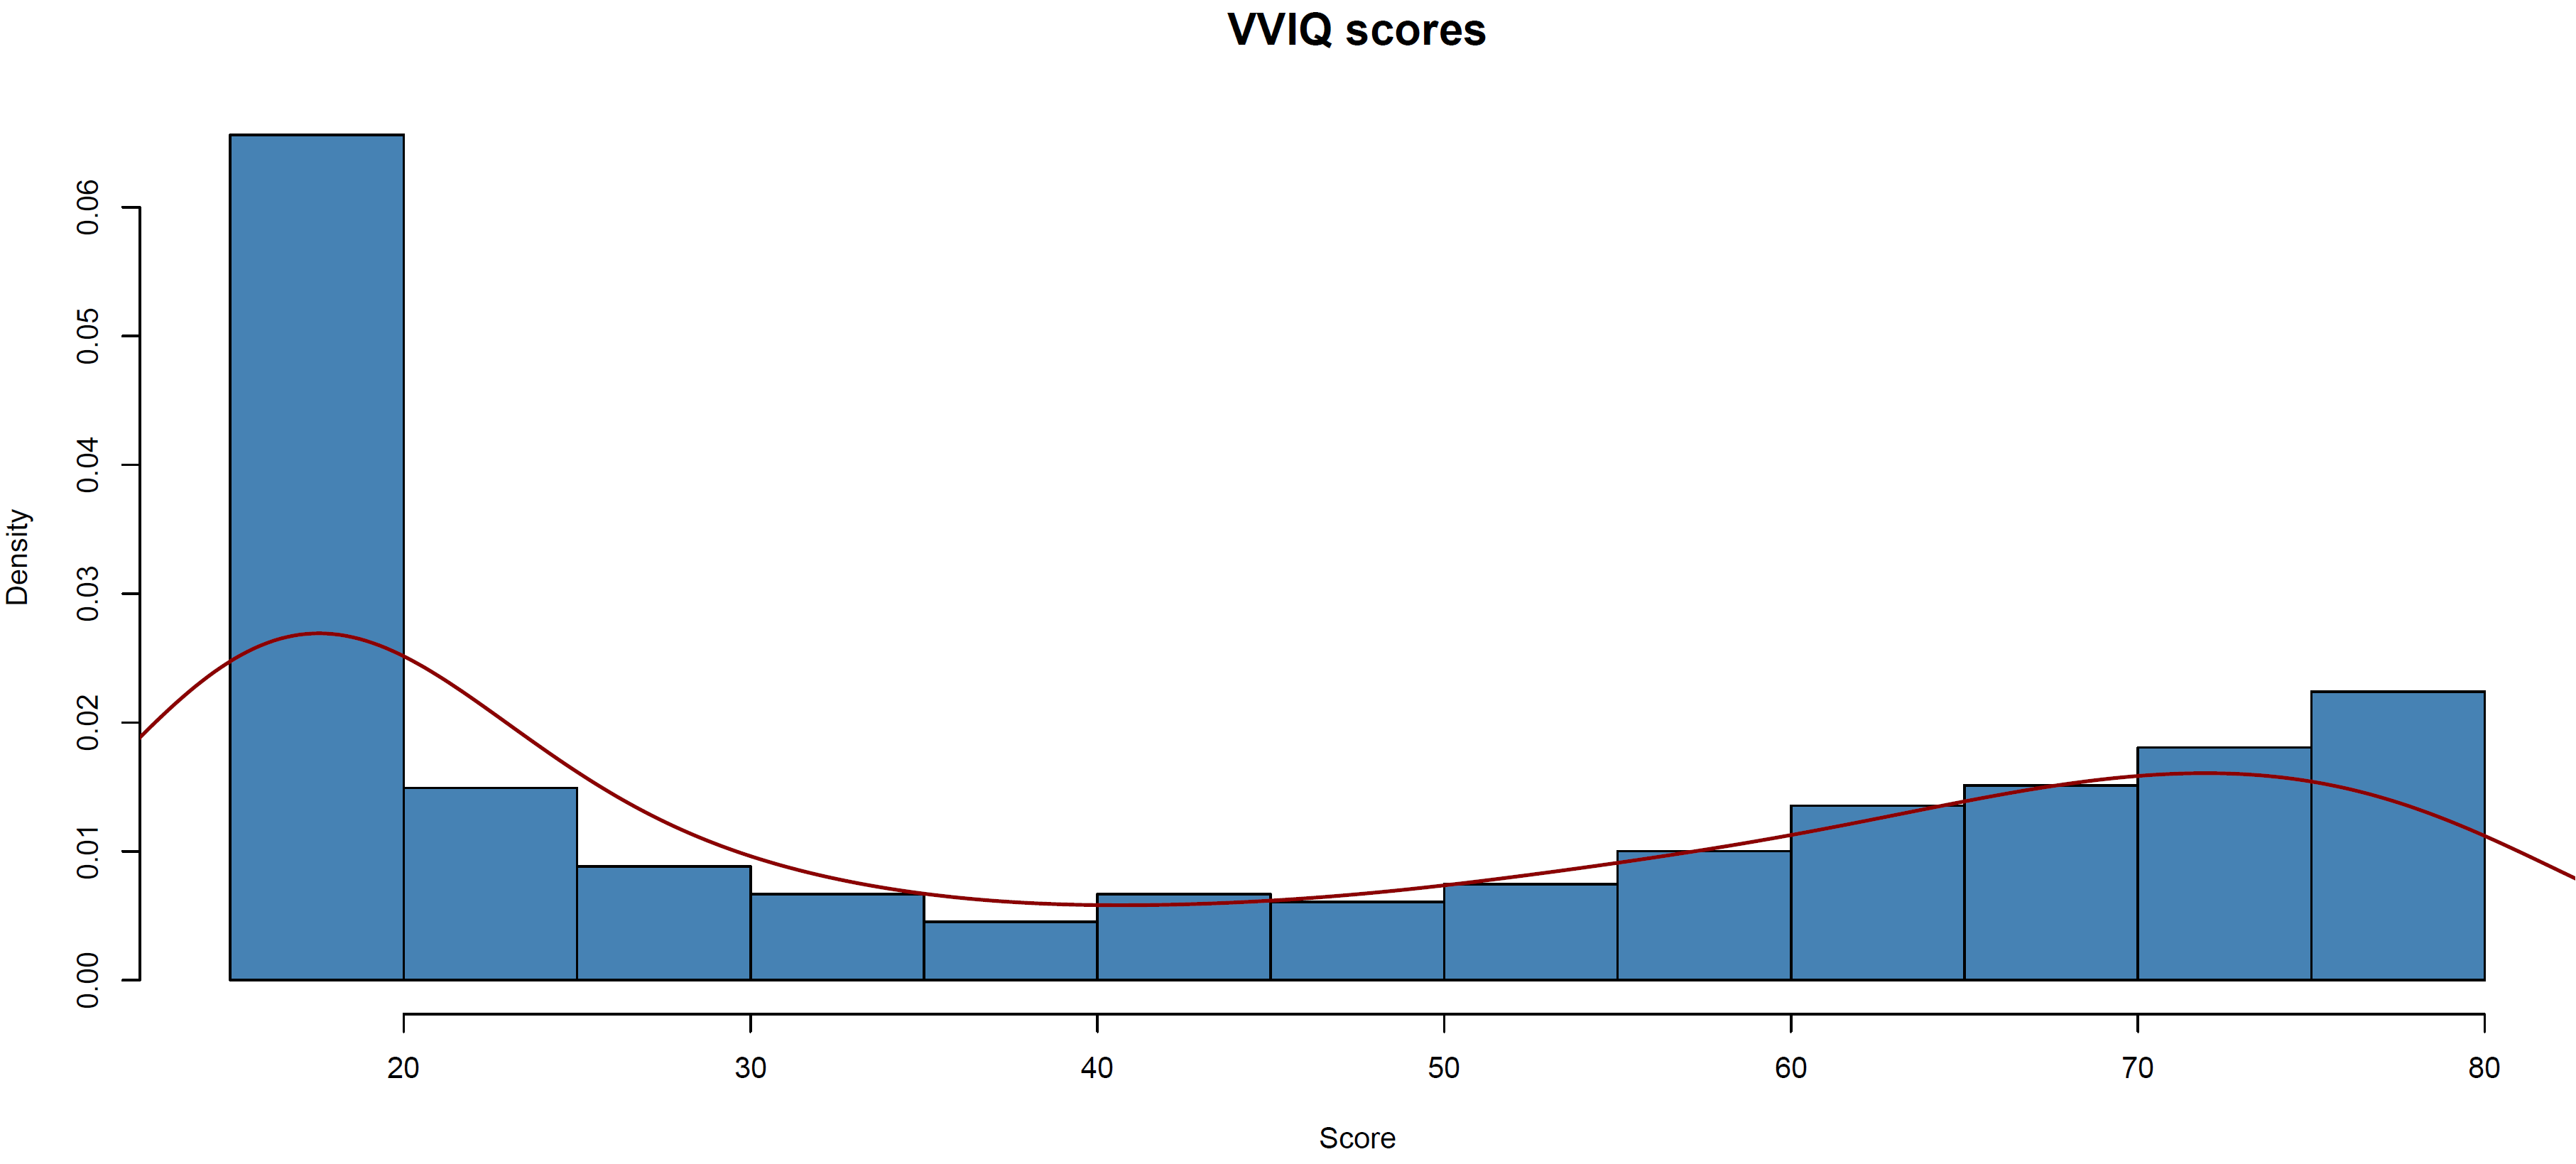
Interestingly, when we plot the new distribution, we have a clear excess of cases:

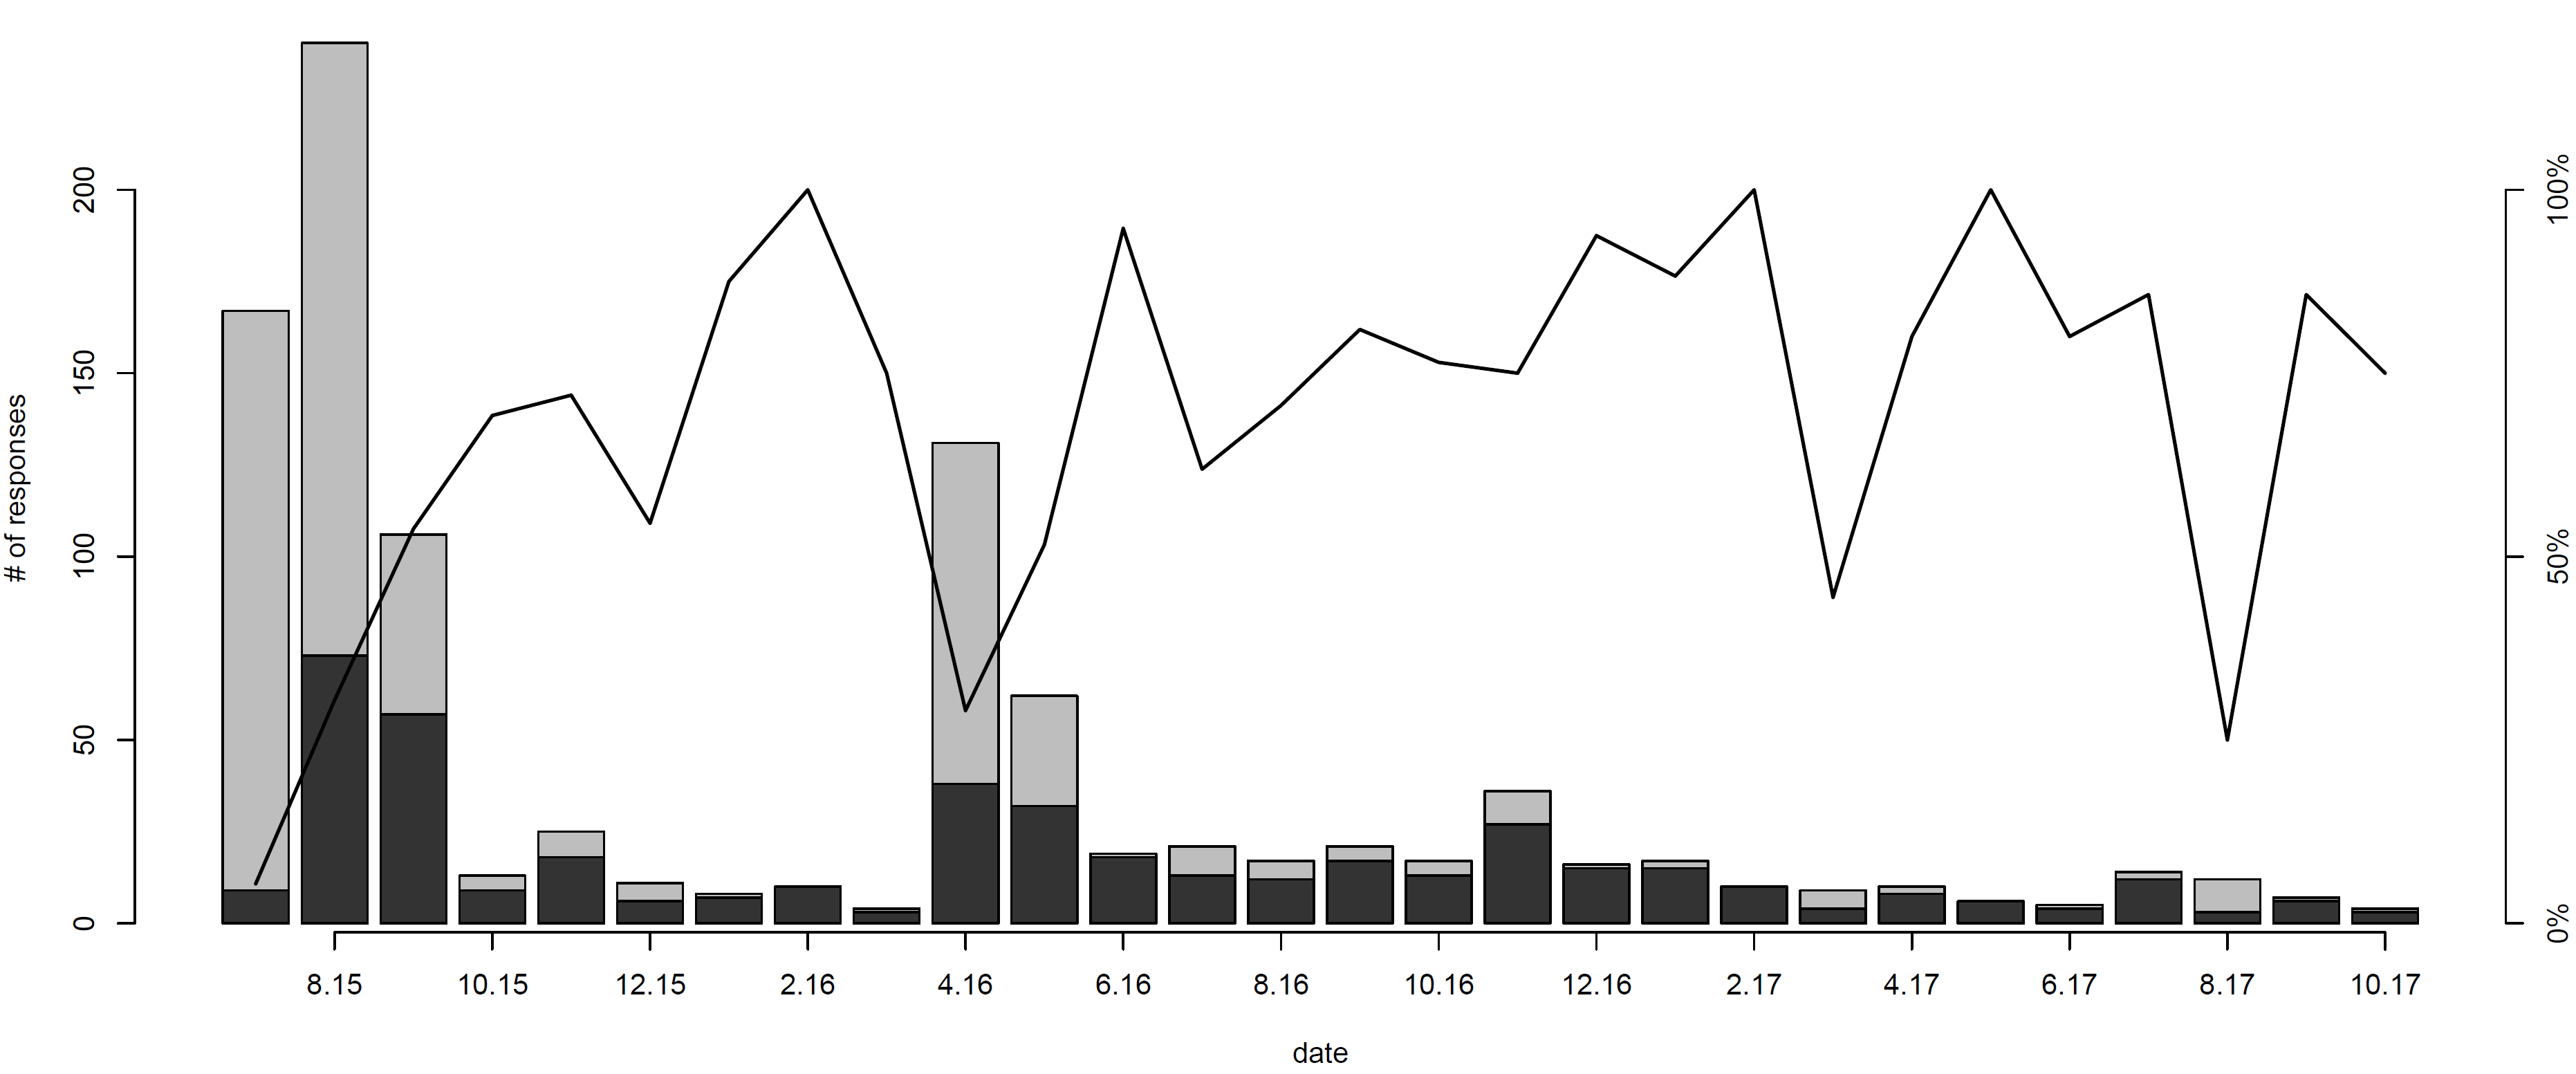
Looking at why that may be, we observe an interesting pattern in the date of the responses and their average score (the curve and dark bars represent the proportion and raw number of respondents, respectively, that have aphantasia):

On average, scores tend to be higher in months where a lot of people are taking the survey. The two spikes in response rate are centered around summer 2015 and summer 2016, which is when we introduced and advertised the study, and shared our early results, respectively. Presumably our sharing the study on social networks resulted in a lot of activity, generating exposure and prompting average netizens to complete the survey. In contrast, after we stopped actively advertising the study, it took more effort to find our study in people’s feeds and through web searches. People who found it and completed it might have been pushed to invest the extra effort because they suspected they might have been affected, explaining the high prevalence in low-activity periods.
This certainly doesn’t mean that the prevalence is higher than we had estimated. On the contrary, we might have overestimated the prevalence like we initially suspected, due to the “low response months” in winter 2015/2016. In the future, we would likely publicise our study again if we wanted to get a robust estimate, and exclude measurements from the low response months to calculate prevalence. A positive point is that we now have many more cases than we previously did : 448 people now have a VVIQ questionnaire score lower than 30, more than 10 times our original number.
This ties into the interesting question of the quality of this data. Since most of the new cases come from a cohort that has actively sought out this questionnaire, it is possible that respondents already had prior knowledge of the condition and had self-diagnosed it, in which case they might have consciously or unconsciously tried to bring their VVIQ scores down. In fact, there has been some discussion and debate around Dr. Zeman’s original article, most of which revolved around whether the condition could be “psychogenic”, in other words, imagined or even voluntary. In the end imaging and psychopathological assessments are likely to be better diagnostic tools than questionnaires, although in confirmed cases, questionnaire data seems to be a good proxy for actual functional impairments. If one day the study of aphantasia is carried into the genetic realm, accurate diagnosis and proper characterisation of endophenotypes will be essential to empower the analysis of this interesting psychological trait.
The code to obtain the above graphs is below (apologies for the cryptic variable names):
d=read.table("K:/Downloads/Aphantasia-reportc.csv", header=T, sep=";")
d$b=as.factor(d$b)
d$c=as.factor(d$c)
d$x=rep("uk", nrow(d))
d$a=NULL;d$t=NULL;d$v=NULL
colnames(d)=c("sex","age","1q1","1q2","1q3","1q4","2q1","2q2","2q3","2q4","3q1","3q2","3q3","3q4","4q1","4q2","4q3","4q4","date", "score","cohort")
means=apply(d, 1, function(x){mean(as.numeric(x[3:18]), na.rm=T)})
for(i in 3:18){
    d[is.na(d[,i]),i]=means[is.na(d[,i])]
}
d$score=rowSums(d[,3:18])
hist(d$score, breaks=20, col="steelblue", main="Pooled scores, both cohorts", xlab="Score", prob=T, cex.main=1.5)
lines(density(d$score), lwd=2, col="darkred")

lines(density(d$score), lwd=2, col="darkred")
e=d[complete.cases(d),]
nrow(e)
hist(e$score, breaks=21, col="steelblue", main="VVIQ scores", xlab="Score", prob=T, cex.main=1.5)
lines(density(d$score), lwd=2, col="darkred")

e$date2=as.Date(t(as.data.frame(strsplit(as.character(e$date), ' ')))[,1], format='%d/%m/%Y')
e$month=as.integer(format(e$date2, format="%m"))
e$year=as.integer(format(e$date2, format="%y"))
a=aggregate(score~month+year, e, mean)
b=aggregate(score~month+year, e, length)
c=barplot(cases[,3])
cases=aggregate(score~month+year, e, function (x) {length(x[x<30])})
resp=cbind(b[,3], cases[,3])
barplot(resp[,1], ylab="# of responses", xlab="date"); barplot(resp[,2], add=T, col="grey20");points(x=c, y=200*resp[,2]/resp[,1], type="l", lwd=2); axis(4, at=c(0, 100, 200), labels=c("0%", "50%", "100%"));axis(1, at=c[1:14*2], labels=paste(a[,1], a[,2], sep=".")[1:14*2])
The raw data files are available on the bitbucket repository of the study (soon to be migrated to github.)
Share